US Virtual Crop Tour
Our team of crop analysts constantly monitor the world’s major growing regions. To understand what’s happening on the ground, we look to the sky by using scientific-grade satellite data to power industry-leading analytics.
This virtual crop tour is for the purpose to check the current conditions in the Corn Belt area in the US and give you insights into what to expect of the key crops in the US.
Day 5
VIRTUAL CROP TOUR: Overview of the last few days
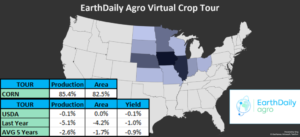
In the 2022 Virtual Crop Tour, EarthDaily Agro toured the entire Corn Belt and analyzed more than 82% of the area devoted to corn cultivation in the United States. Considering the current yield estimate, the eleven states analyzed should account for more than 85% of national production (this percentage may change until the end of the cycle, depending on the revisions in the estimates).
For now, EarthDaily Agro estimates corn production at about 0.2% higher than the USDA estimate, but 4.8% lower than 2021 production and 2.3% lower than the 5-year average. These numbers can still be revised.
UNITED STATES – Virtual Crop Tour identified problems in US corn fields?
YES.
In the west and north of the corn belt, a region that comprises the states of Kansas, Nebraska, South Dakota, North Dakota and Minnesota, crops have suffered from low rainfall and above-average temperatures, as highlighted in the previous days of our Virtual Crop Tour. The current estimate is that the average production of these states is 8.4% lower compared to the trend, which means a drop in production of over 11 million tons.
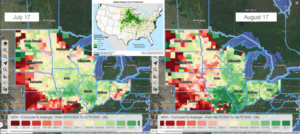
Attention to conditions in Iowa, which accounts for about 17% of the country’s corn production. In the state, especially in the west, the NDVI has deteriorated in mid-August, which suggests that conditions may be worse than currently estimated (see day 4 of the Virtual Crop Tour).
The estimate, carried out on August 19, is that national production will be 6% below the trend (considering the last 15 years), however, there’s still a need to monitor the evolution of the NDVI in the coming weeks, which may result in a variation of our estimate.
If you want to follow our estimates in the coming weeks for the United States and other countries, for corn and other crops, please contact us and purchase our services.
To learn more about EarthDaily Agro, please visit: https://earthdailyagro.com/
Get Custom Insights Tailored to Your Business
EarthDaily Agro is a leading business intelligence provider for the agriculture industry that uses satellite-based Earth Observation to help agribusiness leaders make more informed, more confident decisions. Contact us now to discuss your business needs and learn how Earth Observation can help you work faster, efficiently and cost-effectively.
Day 4
ILLINOIS: Has drought resulted in the collapse of the NDVI in the northwest of the state?
NO.
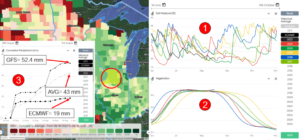
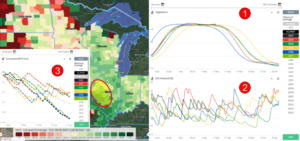
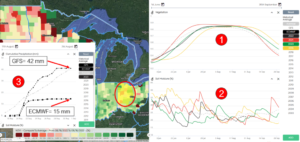
Despite the low soil moisture ① (lower than average since mid-June), the vegetation indices ② has shown good dynamics, especially in the beginning of the second half of August and is currently at the highest level compared to the last five seasons. For the next few days, there are two different scenarios ③: first, the ECMWF expects low precipitation, which will keep soil moisture below average and may limit yield potential; second, the GFS expects good rains for the next few days, which will allow for an increase in soil moisture, favorable for the development of corn. In general, the good evolution of the NDVI indicates good crop conditions in the region, but low soil moisture has limited our optimism.
ILLINOIS: Are crops in the eastern part of the state in good condition?
YES.
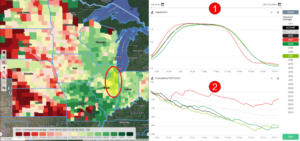
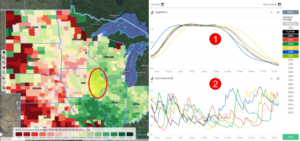
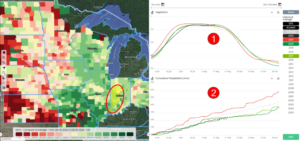
The vegetation indices ① indicate an analogy with the good year of 2017 (when yield was 5% above the trend, considering the last 15 years), as well as the water balance (Precipitation – Evapotranspiration) ②. For the current season, considering the state, the trend indicates yields of 204.1 bushels/acre (12.81 t/ha).
ILLINOIS: Can yield be high in the west of the state?
YES, BUT…
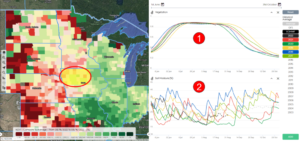
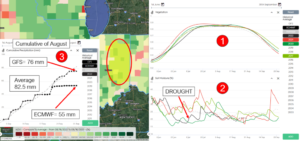
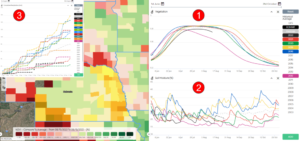
The NDVI ① has shown good evolution, similar to 2021, when the state’s yield was 207 bushels per acre (12.99 t/ha). Good soil moisture ② during July and early August was favorable for maize development. But the volume of precipitation has been low since the end of the first half of the month, which has resulted in a drop in soil moisture. The water balance (Precipitation – Evapotranspiration) ③ in August should end at the lowest level compared to the last five seasons, which makes us remain cautious about the yield potential, despite the good indices.
IOWA: Is the water situation still tense in the eastern state?
NO.
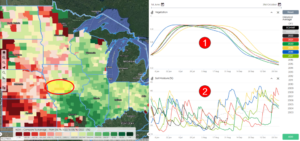
The vegetation indices ① showed an analogy with the years 2017 (good yield; 202 bushels/acre or 13.2 t/ha) and 2020 (poor yield; 184 bushels/acre or 11.55 t/ha) until the beginning of August and, in mid-August, the NDVI showed an improvement in the dynamics, which indicates that the crops are in good condition. The improvement in the NDVI is in line with the increase in soil moisture and, for the next few days, the forecast (ECMWF) is that the soil moisture ② will remain close to the average, above that recorded in 2017 and 2020.
IOWA: Is there a good outlook for the entire state?
NO.
From the central region to the northwest of the state, the NDVI ① started to deteriorate in August, as well as the bad year of 2020. Low precipitation and high temperature can contribute to early senescence, as in 2020, which would probably mean bad yield for the region. It should be noted that soil moisture ② increased in mid-August (to higher levels that recorded in 2020), which alleviated water stress, therefore, there is a need to monitor how the vegetation indices will respond to the increase in soil moisture. A greater volume of rains in the coming days would benefit the corn.
IOWA: Is there cause for concern in any part of the state?
YES
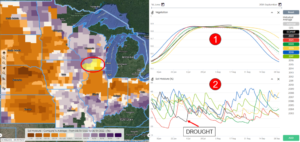
As in the northwest, in the region in yellow on the map, the NDVI ① has shown poor dynamics in August, as well as in 2018, however, in 2018 the beginning of the cycle was positive and limited the loss of yield potential, which does not seem to be the case in the current season. Soil moisture ② increased in mid-August but is expected to drop again in the last weeks of the month. The bad conditions could limit the yield potential of corn. Except for the east of the state, the other regions present challenging conditions.
Get Custom Insights Tailored to Your Business
EarthDaily Agro is a leading business intelligence provider for the agriculture industry that uses satellite-based Earth Observation to help agribusiness leaders make more informed, more confident decisions. Contact us now to discuss your business needs and learn how Earth Observation can help you work faster, efficiently and cost-effectively.
Day 3
OHIO: Can corn recover in Ohio?
YES, BUT…
The vegetation indices ① in the heart of the state’s corn production showed a slight improvement in the beginning of the second half of August, which may indicate a recovery of the crops. The NDVI is similar to the years 2019 (164 bu/acre or 10.29 t/ha) and 2020 (168 bu/acre or 10.55 t/ha), both bad years in terms of yield, which means that more rainfall will be necessary to allow the recovery of crops. Soil moisture ② is expected to remain below average in August, according to the ECMWF, but there is a possibility of a more favorable scenario. For August 18-31 ③, the European model expects low precipitation, however, the American model expects more rain, which should result in a more intense increase in soil moisture.
INDIANA: Is there a chance there will be no crop failure in eastern Indiana?
YES
In the region, the beginning of the cycle was marked by low precipitation and poor NDVI evolution, due to low soil moisture. However, the improvement in rainfall in July allowed the crops to recover in recent weeks and the vegetation indices ① showed good dynamics in mid-August (until 8/17). The forecast is that soil moisture ② remains below average during the second half of August, which may limit the recovery of crops, but as in Ohio, the American model expects greater rainfall ③, which will result in in increasing soil moisture, positive for crops.
INDIANA: Is there a sign of NDVI collapse in western Indiana?
NO.
Vegetation indices ① had a good evolution in the first half of August, which indicates a recovery of crops, which suffered from drought at the beginning of the cycle. The accumulated precipitation ② shows an analogy with the year 2017, when the productivity of the state was 3% above the trend (considering a 15-year trend). For now, we are considering a negative trend, due to the bad evolution at the beginning of the cycle, but if the dynamics remain positive, the perspective is for an increase in the estimate, which currently stands at 182.15 bushels/acre (11.43 t/ha ).
WISCONSIN: Can there be good yields in Wisconsin?
YES, BUT…
The vegetation indices ① show good dynamics in August and in the middle of the month the NDVI was at its highest level compared to the same period in previous years. The beginning of the evolution of the vegetation indices was bad, but similar to the good year of 2017 (yield 4% above the trend), however the drought at the beginning of the cycle and soil moisture ② at a lower level than the 2017 season limits optimism in terms of yield potential.
Get Custom Insights Tailored to Your Business
EarthDaily Agro is a leading business intelligence provider for the agriculture industry that uses satellite-based Earth Observation to help agribusiness leaders make more informed, more confident decisions. Contact us now to discuss your business needs and learn how Earth Observation can help you work faster, efficiently and cost-effectively.
Day 2
SOUTH DAKOTA: Can there be a crop failure in the central south of the state?
YES.
Vegetation indices ① are showing poor dynamics, especially since the beginning of August. The NDVI is at a lower level than the bad year of 2021 (-13%) and the water balance (Precipitation – Evapotranspiration) ② shows an analogy with the last season. More rain is needed to alleviate water stress, but it’s likely that even if the rains return, there will already be consolidated damage to the crops.
SOUTH DAKOTA: Does the north of the state have good conditions?
NO, BUT COULD BE WORSE
In the north of the state, the NDVI ① is in line with the average, similar to the year 2017 (+1%). However, low soil moisture ② is cause for concern. The forecast expects a continuation of the drought for the region. It will be necessary to closely monitor the evolution of vegetation indices, which may show accelerated deterioration in the coming days, especially if the drought continues.
NORTH DAKOTA: Are conditions worse than compared to the Southwest?
NO.
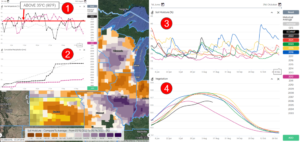
After the high rainfall in May, which resulted in late planting, the volume of rainfall has decreased, but the soil moisture ① is close to average, higher than last year, as well as the NDVI which, although not high, indicates better conditions than in the previous season. The forecast expects soil moisture to increase in the coming days, which is favorable for the crops, but the NDVI ② (although it is better than the previous season) is not great and limits any optimism about the yield potential.
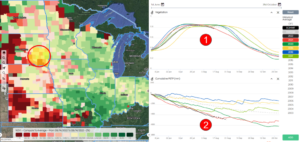
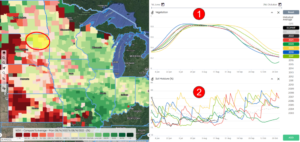
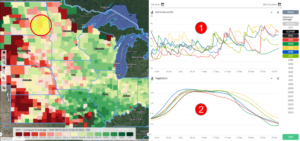
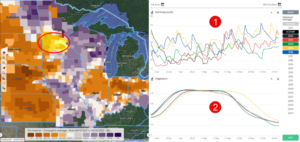
MINNESOTA: Vegetation indices already showing signs of collapse in the central region of the state?
NO.
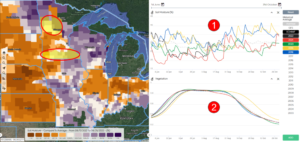
Heavy rains in May resulted in late planting, which justifies the delay in the evolution of vegetation indices in the current season. However, drought has prevailed in the central region of the state (in yellow on the map) and soil moisture ① is expected to remain below average in the coming weeks. For now, NDVI ② hasn’t collapsed yet, but how long can it hold without good soil moisture? The continuation of the drought is cause for concern.
MINNESOTA: Should the water situation remain tense across the state?
NO.
In the north and south of the state, soil moisture ① increased in early August and the forecast (ECMWF) predicts moisture still above average in the short term, which will be favorable for corn fields. The vegetation indices ② is in line with the average but has shown a slight worsening of the dynamics in recent days, so it will be necessary to closely monitor the evolution of the NDVI in the coming days. If there is an early senescence, this will be an indication that the yield potential could be lower than the trend (195 bushels/acre or 12.24 t/ha).
Get Custom Insights Tailored to Your Business
EarthDaily Agro is a leading business intelligence provider for the agriculture industry that uses satellite-based Earth Observation to help agribusiness leaders make more informed, more confident decisions. Contact us now to discuss your business needs and learn how Earth Observation can help you work faster, efficiently and cost-effectively.
Day 1
KANSAS: Are there already consolidated losses?
YES.
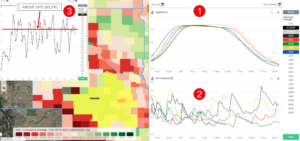
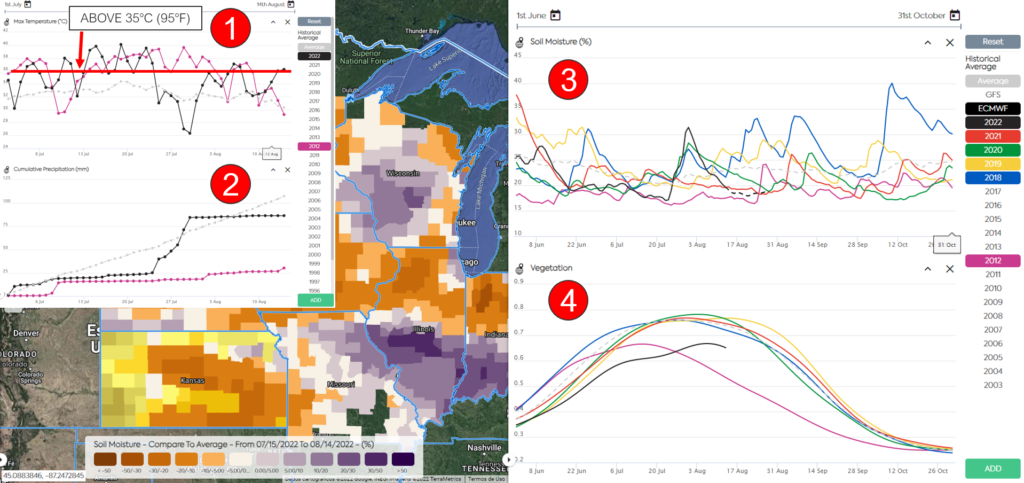
The association between high temperature ① (23 days with temperatures above 35°C since the beginning of July) and low rainfall ② (only 1.68 mm in the first half of August; average of 37.91 mm) maintained the soil moisture low ③, with the exception of late July and early August, when most of the rainfall recorded in the last 45 days occurred. The vegetation indices ④ has shown poor dynamics since the beginning of the cycle, although it’s higher than the bad year of 2012, when yield was 25% below the trend. Even if the weather conditions improve (and the ECMWF predicts low precipitation for the short term) there are already consolidated losses in the Kansas cornfields.
MISSOURI: Missouri crops have also suffered from drought?
NO.
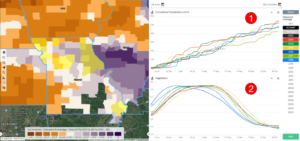
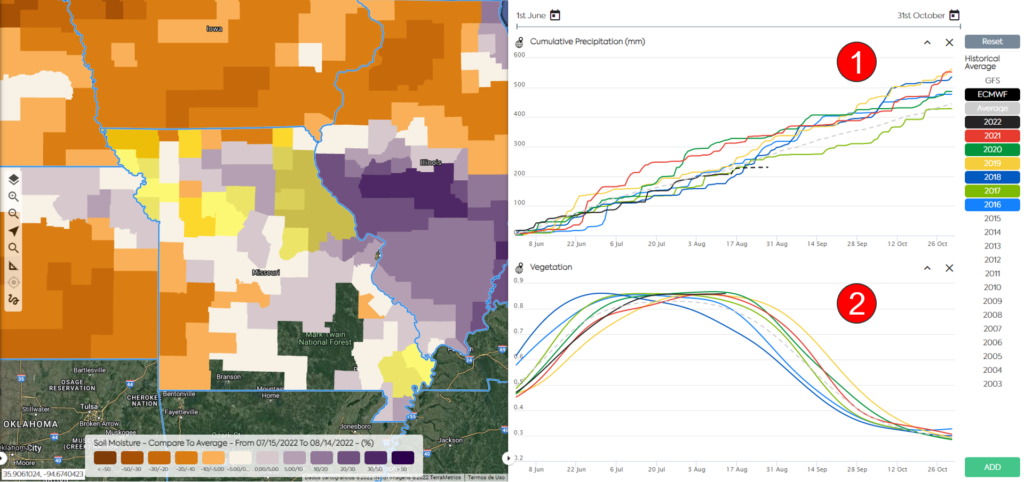
The cumulative precipitation ①, considering since the beginning of June, is slightly below average, similar to the good year of 2017. The vegetation indices ② showed good dynamics in recent weeks, which indicates that the crops are in good condition. However, the NDVI had a bad evolution at the beginning of the cycle, which limits the optimism about the yield potential.
NEBRASKA: Does NDVI indicate strong crop failure across the state?
NO.
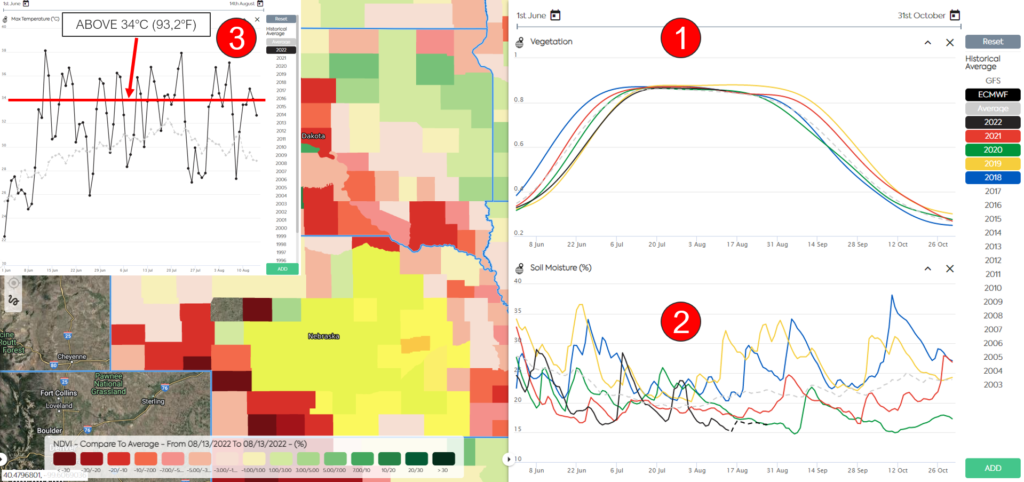
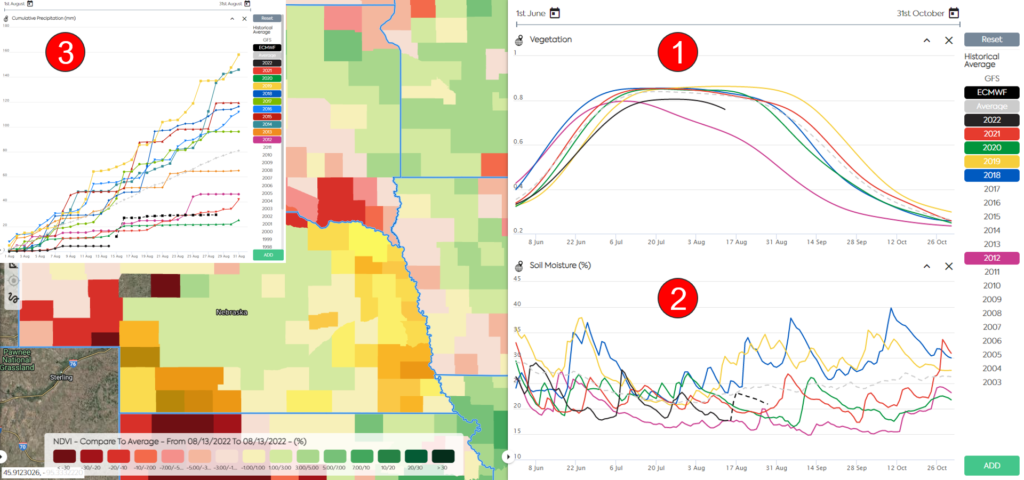
In the central region of the state, vegetation indices ① showed an evolution very similar to 2019 (yield -2%), but with poor dynamics in recent days, which may be a reflection of the drop in soil moisture ② and of the high temperatures ③ recorded in July. Although the NDVI is slightly above average and at a higher level than compared to other regions. Despite better conditions than in other regions, we do not expect good yield potential, especially with the forecast of continued drought.
NEBRASKA: Does NDVI indicate a catastrophic scenario in western and eastern Nebraska?
YES.
In the western and eastern regions of the state are located the crops with the worst conditions in the state. NDVI ① indicates a low yield potential, reflecting the low soil moisture ② during the cycle so far. In August, the cumulative precipitation ③ during the first 14 days was only 4.34 mm (0.17 in). The forecast points to good rains on August 15th and 16th, but still insufficient to reverse the situation. The perspective is that yield will remain below 11.6 tonnes/ha (less than 185 bushels/acre).
Get Custom Insights Tailored to Your Business
EarthDaily Agro is a leading business intelligence provider for the agriculture industry that uses satellite-based Earth Observation to help agribusiness leaders make more informed, more confident decisions. Contact us now to discuss your business needs and learn how Earth Observation can help you work faster, efficiently and cost-effectively.
Our team of crop analysts constantly monitor the world’s major growing regions. To understand what’s happening on the ground, we look to the sky by using scientific-grade satellite data to power industry-leading analytics.
This virtual crop tour is for the purpose to check the current conditions in the Corn Belt area in the US and give you insights into what to expect of the key crops in the US.
Day 1
KANSAS: Are there already consolidated losses?
YES.
The association between high temperature ① (23 days with temperatures above 35°C since the beginning of July) and low rainfall ② (only 1.68 mm in the first half of August; average of 37.91 mm) maintained the soil moisture low ③, with the exception of late July and early August, when most of the rainfall recorded in the last 45 days occurred. The vegetation indices ④ has shown poor dynamics since the beginning of the cycle, although it’s higher than the bad year of 2012, when yield was 25% below the trend. Even if the weather conditions improve (and the ECMWF predicts low precipitation for the short term) there are already consolidated losses in the Kansas cornfields.
MISSOURI: Missouri crops have also suffered from drought?
NO.
The cumulative precipitation ①, considering since the beginning of June, is slightly below average, similar to the good year of 2017. The vegetation indices ② showed good dynamics in recent weeks, which indicates that the crops are in good condition. However, the NDVI had a bad evolution at the beginning of the cycle, which limits the optimism about the yield potential.
NEBRASKA: Does NDVI indicate strong crop failure across the state?
NO.
In the central region of the state, vegetation indices ① showed an evolution very similar to 2019 (yield -2%), but with poor dynamics in recent days, which may be a reflection of the drop in soil moisture ② and of the high temperatures ③ recorded in July. Although the NDVI is slightly above average and at a higher level than compared to other regions. Despite better conditions than in other regions, we do not expect good yield potential, especially with the forecast of continued drought.
NEBRASKA: Does NDVI indicate catastrophic scenario in western and eastern Nebraska?
YES.
In the western and eastern regions of the state are located the crops with the worst conditions in the state. NDVI ① indicates a low yield potential, reflecting the low soil moisture ② during the cycle so far. In August, the cumulative precipitation ③ during the first 14 days was only 4.34 mm (0.17 in). The forecast points to good rains on August 15th and 16th, but still insufficient to reverse the situation. The perspective is that yield will remain below 11.6 tonnes/ha (less than 185 bushels/acre).
Get Custom Insights Tailored to Your Business
EarthDaily Agro is a leading business intelligence provider for the agriculture industry that uses satellite-based Earth Observation to help agribusiness leaders make more informed, more confident decisions. Contact us now to discuss your business needs and learn how Earth Observation can help you work faster, efficiently and cost-effectively.

