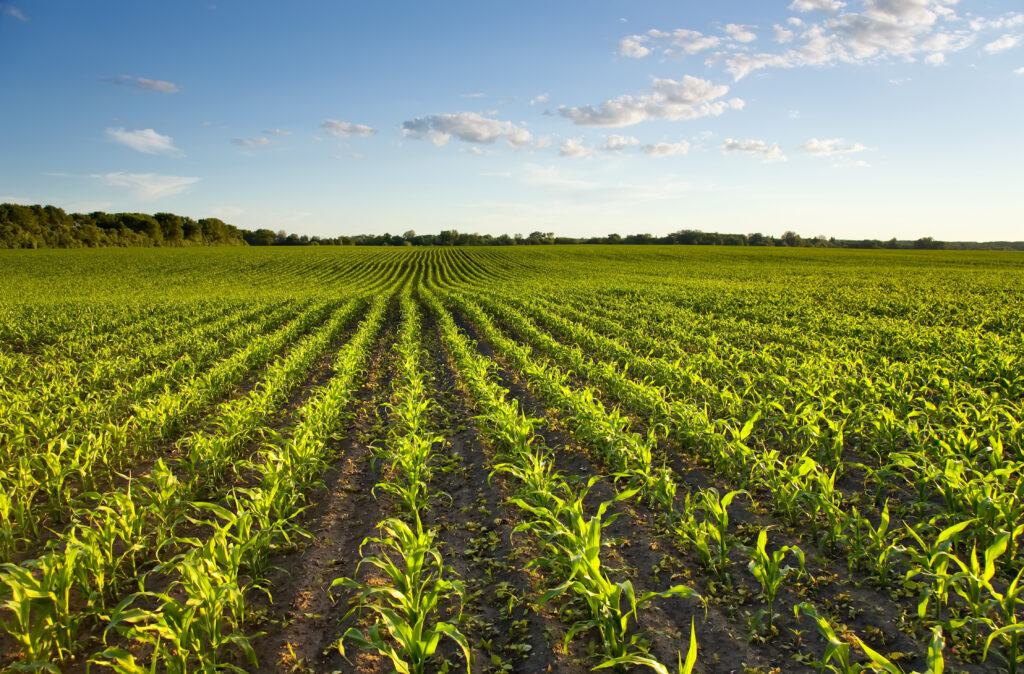
Yield Monitoring Case Study – Iowa Corn
While the idea of a “typical year” seems to be fading, most viewed the 2018 weather in Iowa as fairly typical. And, according to the USDA, 2018 was going to be another record-breaking year for with Iowa corn yield estimates exceeding 2017 at 202 bpa and the 2016 record of 203 bpa. So, when the USDA lowered its yield estimate for Iowa in the November WASDE report to 198.0 bpa – down 8.0 bpa from its September estimate – many were surprised.
But not our Agriquest® global monitoring tool subscribers. We saw this coming.
Some farmers in Iowa were skeptical of the USDA estimate in October due to “wetter-than-normal weather and rain-delayed harvest.” However, these were not the main contributing factors to the lower yield. Through the Agriquest® tool, we could see evidence of lower yields as early as June with clear indications going into July and August.
Through the Agriquest® tool, we analyze key weather factors impacting crops and how the crops react to the given conditions. In this case study, we’ll simply take a look at:
- Temperatures
- Precipitation
- Vegetative Health
The tool enables users to evaluate these factors in relation to each other and in relation to past years. Knowing the yields for past years, we can use them as references for the current season and anticipate yield outcomes. Based on the USDA estimates, we would have expected to see trends similar to or exceeding those of 2017 and 2016 – but what we saw was very different and it enabled us to better position our clients with accurate yield expectations.
A Closer Look
While the average temperature in July 2018 was equal to or below the average compared to 2017 and 2016 in Iowa, June 2018 was hot which stressed the developing corn.
Precipitation was above average in June and August for 2018, but July was dry and well below average. July is when corn is in its silking stage – a key growth stage for the plant and one that requires good moisture levels. The cumulative precipitation for July 2018 was below that of 2017 and 2016. We could also see the rapidly declining soil moisture during July would stress the corn.
We knew the stress of the June heat and July dryness would have an impact on yield. However, our best indication for lower yields in 2018 was evident in the vegetative health.
Through the Agriquest® tool, we could see a noticeably rapid decline of vegetative health from June through August. During this same period the USDA was raising yield potential to 206 bpa in their September report – three points above the 2016 record. When we compared the vegetative health for July 2018 to the reference years of 2017 and 2016, we can see that the vegetative health was not significantly better, which is what we’d expect to see for a higher yield prediction. The same trend is noted when you expand the timeframe from May 1 to September 12 for 2018 compared to 2017 and 2016.
When we compared the 2018, 2017, 2016 and 2015 crop cycle NDVI curves against average vegetative health the last 15 years, we can see the rapid decline of the NDVI curve after peaking in early July which indicates a high potential for yield loss.
We were able to share these insights with customers throughout the season, so they were well positioned for the reality of the Iowa corn crop in 2018.
Continuous Improvements
And we’re proud to announce that we’ve taken these insights a step further this year with the launch of our corn and soybean crop mask within the Agriquest® tool. Using this mask, we are able to distinguish the signals from corn verse soybeans – allowing for pure corn or soybean Vegetation Index maps and graphs.
You can see how this mask enhances our insights using the 2018 Iowa corn example or contact us for a demonstration to see how you can put the Agriquest® tool to work for your business.

