Time Series Mastery: How to Use Field History to Enhance Future Agronomy
Satellite Imagery allows users to monitor near–real–time crop growth conditions along the vegetation cycle. A Satellite Image Time Series is a sequence of images taken over the same area at various intervals. Time series of indices derived from reflectance data, such as NDVI and LAI are used to assess the evolution of the vegetation and evaluate positive or negative change. In addition, advanced algorithms like yield, phenology, and crop identification use time series as its primary analytics.
How Different Resolutions Create Different Types of Time Series
When talking about Satellite Image Time Series, there are mainly two sources of satellite images that are commonly used:
Low Resolution Imagery like MODIS, VIIRS, Sentinel-3 Data, has a pixel resolution of around 250-500m and daily acquisition. The key advantage of this type of data in the agricultural sector is the daily frequency of acquisition worldwide, providing daily crop monitoring. The same factors that allow this data to be captured regularly at a global scale are also what cause the spatial resolution to be low.
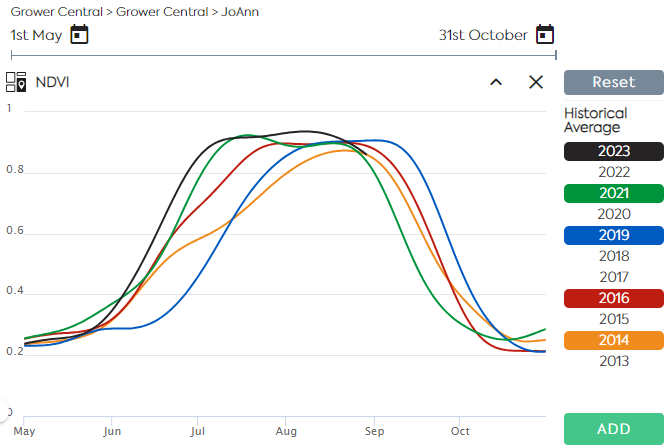
Since 2019, EarthDaily Agro provides Satellite Image Time Series derived from MODIS data to monitor crop development at the field level. With the ability to look back in time from 2003, it enables key high-level intelligence gathering at scale such as comparing present-day crop development with previous seasons for a given field. During the current season, the daily acquisition allows benchmarking crop development for a set of fields.
Figure 1: Comparison of Soybean crop development over history using Low Resolution Time Series for a 70 ha field located in Iowa, US.
Medium Resolution Imagery like Sentinel-2, Landsat 8/9, has a pixel resolution of 10-30m and an acquisition frequency of about once a week (5 days for Sentinel 2 and 8 days for Landsat 8 & 9). The Sentinel and Landsat missions are well-known for their spatial resolution, allowing them to provide more details at the field level.
EarthDaily Agro now provides satellite image time series derived from its virtual constellation, combining public and tasked medium resolution images for VNIR and SWIR bands. The radiometry of the public and tasked data is cross-calibrated to ensure temporal consistency of the data; allowing dense multi-sensors time series.
The medium resolution time series are well-suited to monitor crop development of small-sized fields, like in Western Europe for instance, where the benefice of high frequency-low resolution imagery is offsetted by their coarse resolution and its ability to represent the signal of the field.
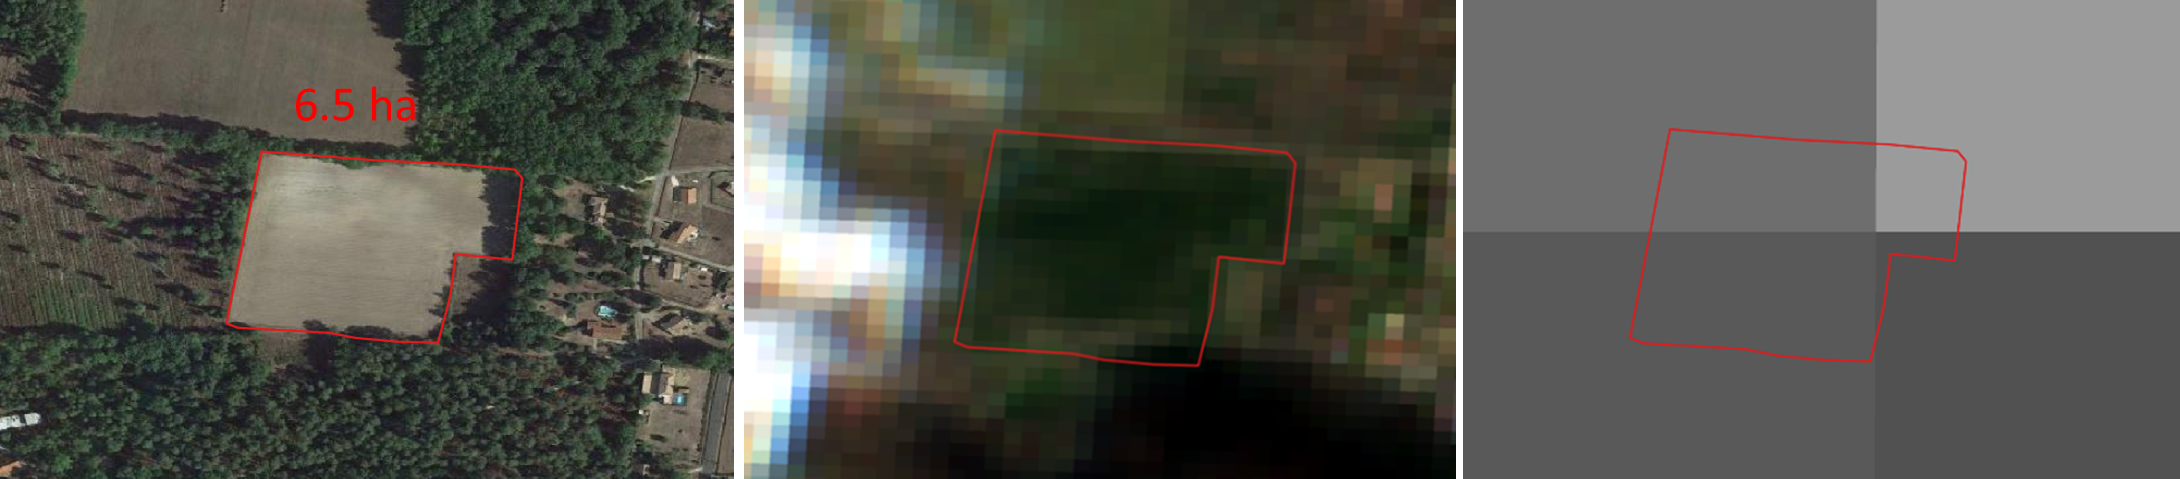
Figure 2: On the left side, here is a 6.5 ha wheat field located in the United Kingdom. In the middle, are the pixels of a Sentinel 2 image. On the right side, are the pixels of the MODIS image.
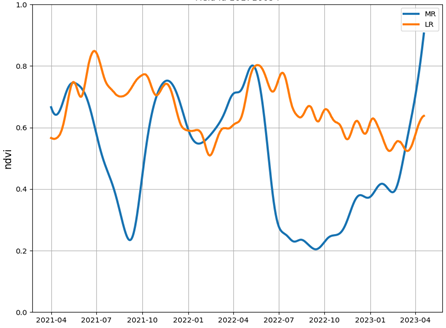
Figure 3: Comparison of Medium Resolution Time Series (MR) and Low-Resolution Time Series (LR) for a wheat field (6,5 ha) located in the United Kingdom.
Customize Your Time Series
EarthDaily Agro offers its API users the capacity to retrieve reflectance data or vegetation indices satellite image time series for a given field.
The users can also choose the spatial aggregation operator of interest among median, mean, max, min and standard deviation.
As different use cases – such as extracting phenological information from times series or doing crop classification -can require adapting the processing steps, EarthDaily Agro provides a flexible approach with the option to select or not the processing steps to be applied. It is for example possible to select the smoothing algorithm applied among Weighted Whittaker and Savitzy Golay, which are both well-known to data scientists.
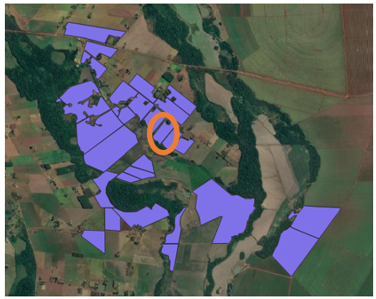
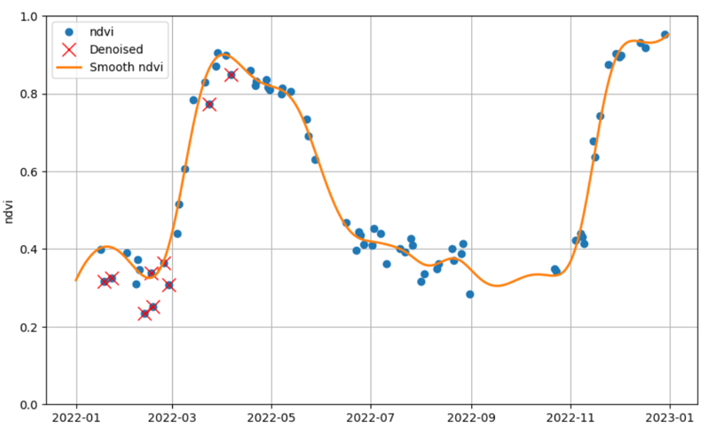
Figure 4: For a field (8,81 ha) located in Brazil. The blue dots represent the mean NDVI value for each satellite image date. Some values (red cross) are denoised as they are impacted by cloud residuals. The data is then interpolated by applying a Weighted Whittaker Smoothing algorithm (orange curve).
How to Use Satellite Imagery Time Series Effectively
Satellite Image Time Series are used for several advanced analytics where the accuracy of the computed analytic is directly correlated to the quality of the time series:
- Phenology Detection with the detection of emergence, flowering or harvest date is often derived from Satellite Image Time Series. The more representative of the vegetation crop cycle the Time Series is, the more accurate the detection of the emergence, flowering or harvest data is.
- Crop Identification to better understand what the planted crops are over a territory, especially for species having close spectral signatures – corn and soybean for instance.
- Yield Modeling is where the performance of a crop is correlated with the shape of the crop cycle.
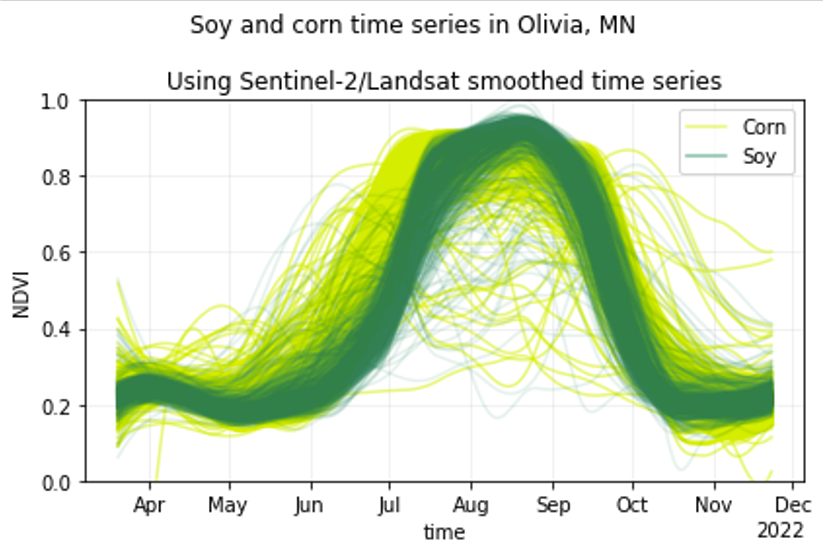
Figure 5: Medium resolution time series using Sentinel 2 and Landsat for corn and soybean fields in the Olivia county, MN. We can see a slight shift between Corn and Soybean spectral signature that can used for crop identification model.
EarthDaily Agro is providing analysis-ready Satellite Image Time Series to be ingested in Machine Learning pipelines as well as advanced analytics to make informed decisions.
What Next?
The launch of the EarthDaily Constellation will commence in 2024 and when this fleet is fully operational, it will have 22 spectral bands and daily acquisitions on a global scale. Imagery produced from this constellation will have a processed resolution of 3.5m per pixel.
This will allow us to essentially forge a new category of Satellite Image Time Series that combines the best of two worlds: the frequency of acquisition of low-resolution data with the accuracy of the medium resolution data.
Please contact us for more details.