Virtual Crop Tour in Brazil
Our team of crop analysts constantly monitor the world’s major growing regions. To understand what’s happening on the ground, we look to the sky by using scientific-grade satellite data to power industry-leading analytics.
The Virtual Crop Tour aims to check the current conditions in Brazilian crops and provide information on what to expect from crop production in the current season.
Day 5
Did drought impact more than just southern Brazil?
YES
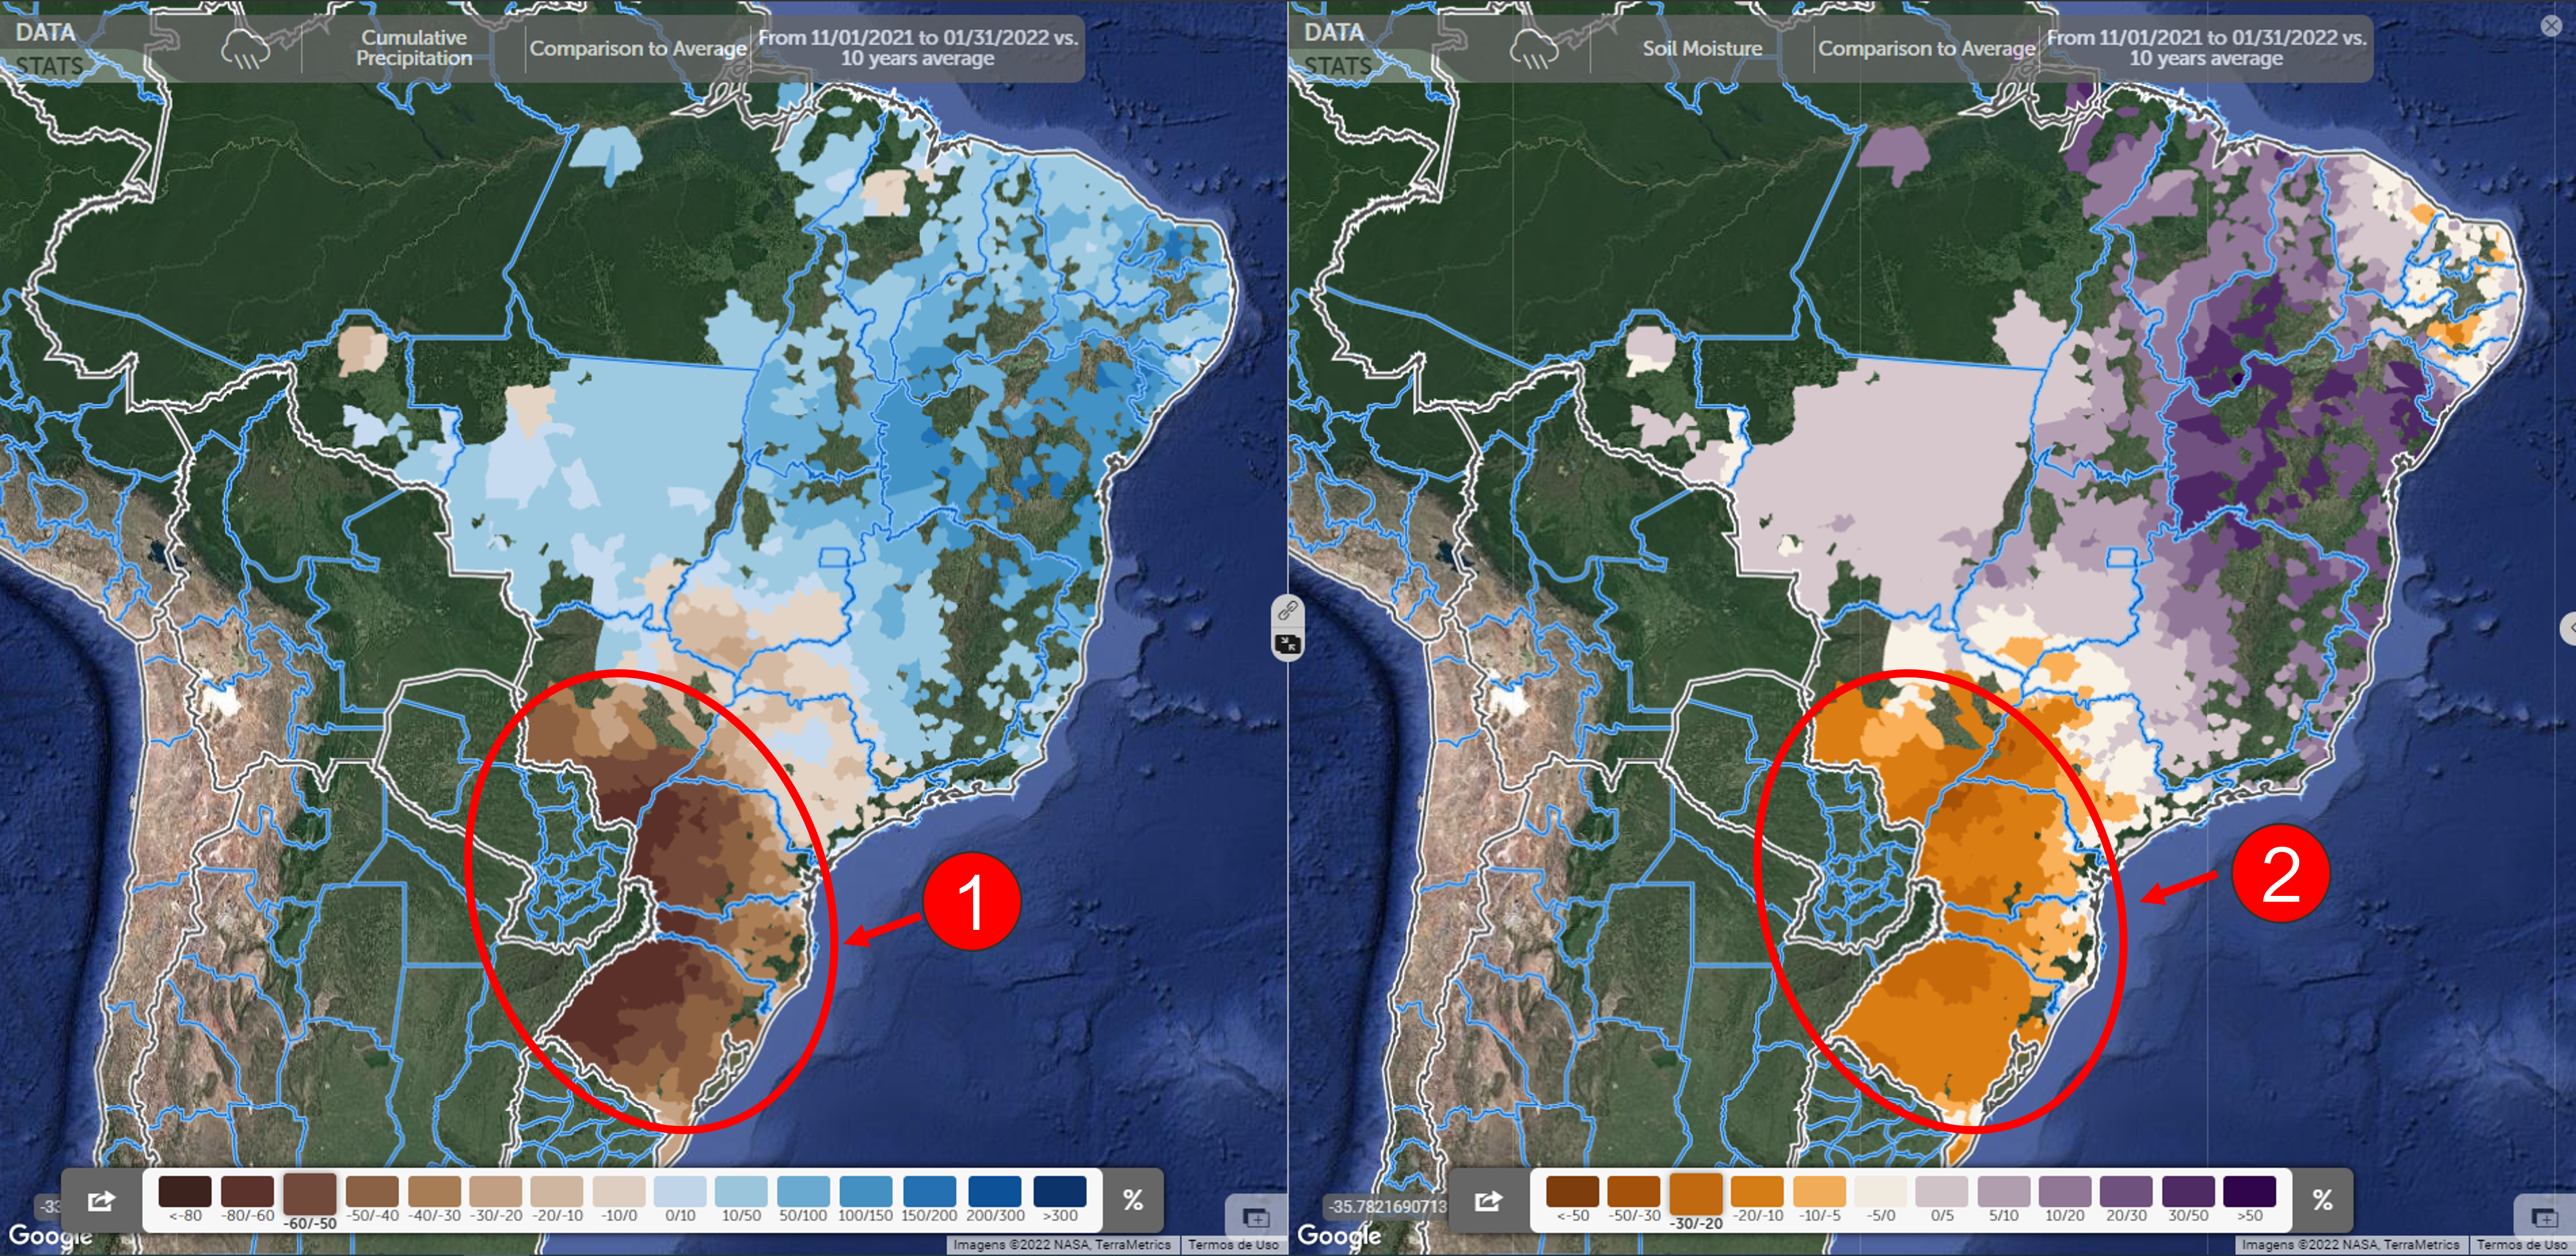
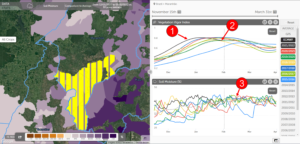
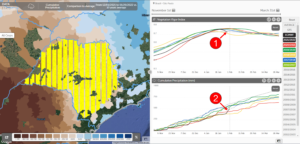
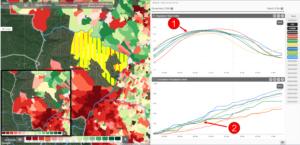
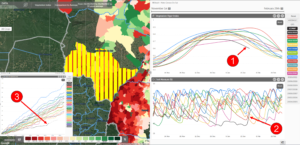
Considering from the beginning of November to the end of January, the drought ① extended from the extreme south of the country to the central region of Mato Grosso do Sul, including part of the west of São Paulo. In these regions, soil moisture ② remained at historically low levels (from 20% to 50% below the average, depending on the area), which limited the yield potential of the crops.
Could a catastrophic scenario in the Center-South of the country have been predicted at the end of 2021?
YES
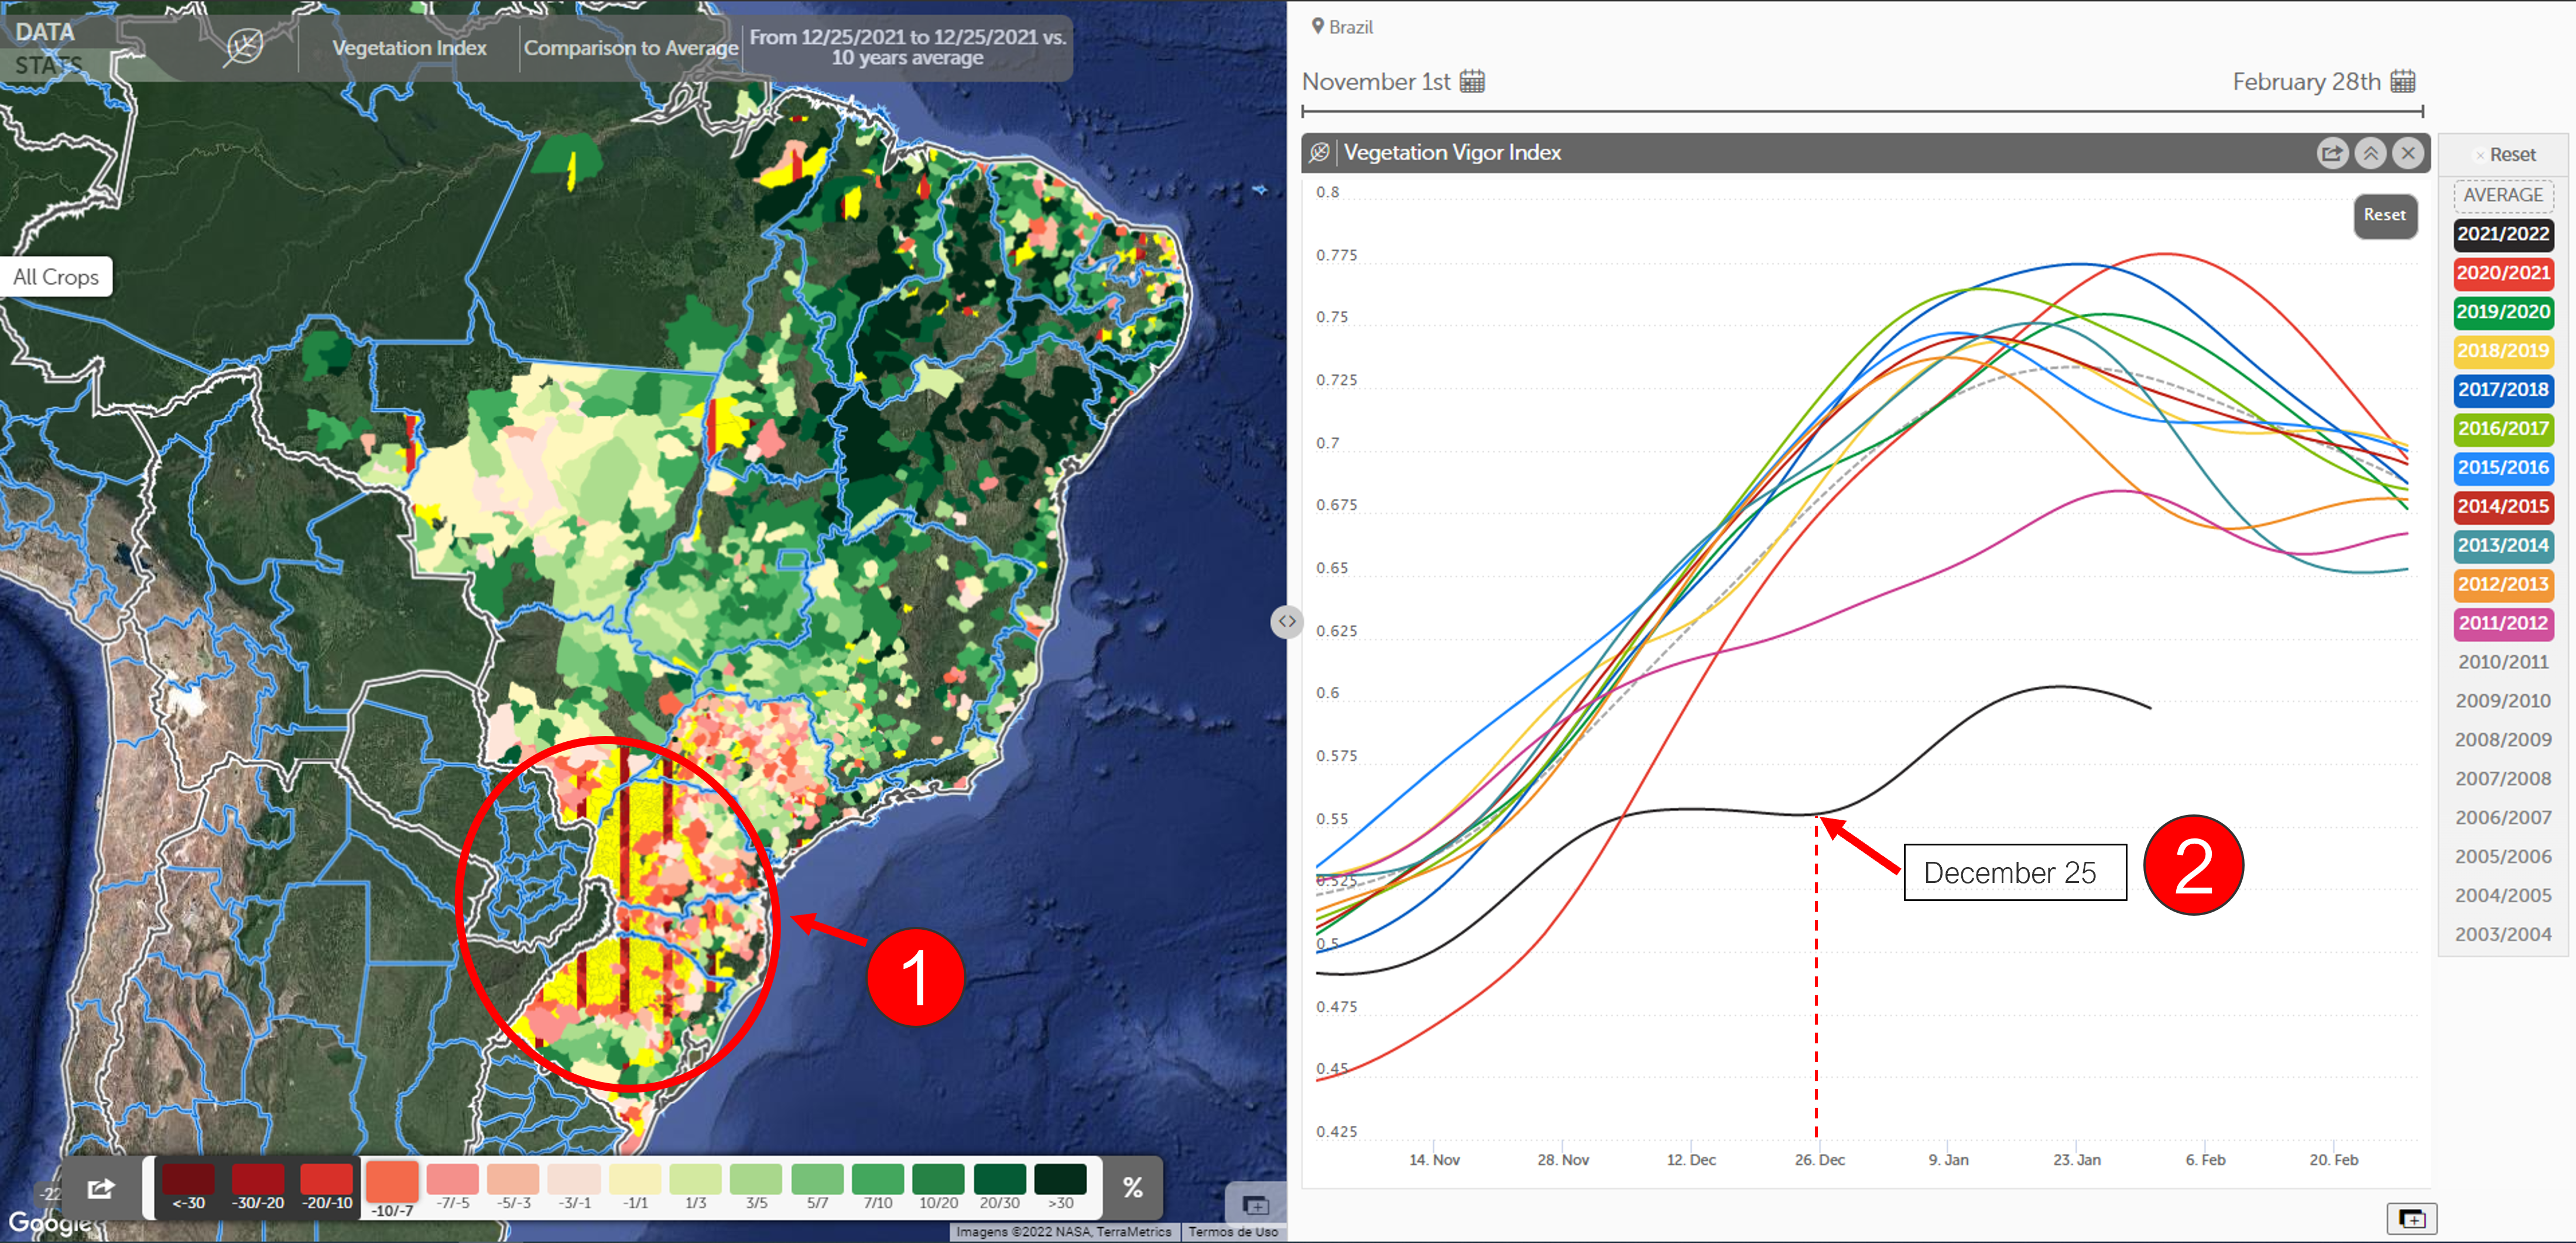
In the last analysis carried out by our analysts at the end of 2021, the estimate for soybean production was cut to 129 million tons. The reason for the strong cut was the extremely poor performance of vegetation indices in the Center-South of the country and, even if there was a good volume of rains in January, a part of the production was already compromised in the region. In January, the drought continued in the South and spread to other regions of Mato Grosso do Sul, which made us reduce the estimate again at the end of January. Currently, Brazilian soybean production is estimated at 125.35 million tons. The estimate can still be revised in the coming days, depending on the feedbacks coming from the fields.
EarthDaily Agro Virtual Crop Tour
On the last day of the Brazil Virtual Crop Tour, we brought an overview of what was seen throughout the week.
The Virtual Crop Tour covered about 94% of the total area destined for soybean in the 2021/2022 season, analyzing a total of eleven states. It is estimated that production in these regions is responsible for about 93% of Brazilian soybean production.
The Virtual Crop Tour was carried out from 01/31 to 02/04 and had the purpose of evaluating the conditions of the crops in the main agricultural regions of Brazil, in order to clarify the scenario for EarthDaily Agro’s customers.
To find out about production estimates from Brazil and other countries, contact us and purchase our services.
If you’re interested in learning more about how our global experts can help your business with weekly crop and weather analysis, send us a message to get started.
Day 4
Western Paraná – Is the drought the most intense in recent years?
YES
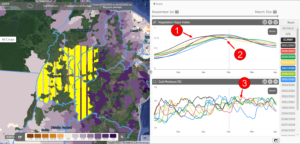
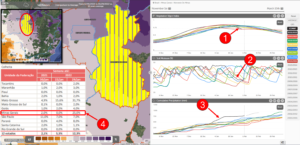
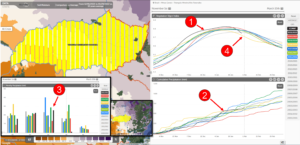
The vegetation indices ① is at the lowest level of the last 10 years, even lower than 2012 (year in which the yield was 38% below the trend), which indicates a yield below that 2012. The low cumulative precipitation ② in recent months it has kept soil moisture ③ at an insufficient level for good crop development. However, the return of the rains ④ in recent days was important to recover soil moisture for the beginning of the second corn crop.
East Paraná – January 2022 was the driest January in the last 10 years?
NOT
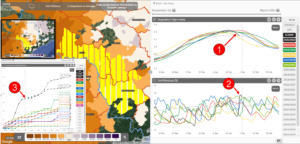
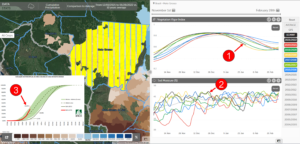
Considering since the beginning of the year, the cumulative precipitation ① is below average (water stress is even more intense if considering the entire soybean cycle, starting in November), however, the volume of rainfall was higher compared to the western region, which allowed the recovery of soil moisture ② in January and better development of crops compared to other regions of the state. NDVI ③ was close to the average and similar to 2012, 2014 and 2019 seasons (years in which there was a crop failure), which suggests that even with a more favourable water situation, there was still a reduction in the yield potential caused by the rainfall restriction.
Parana – Productivity should be the lowest in the last 15 years?
YES
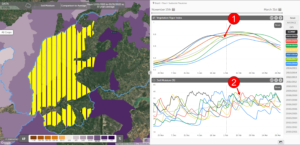
The NDVI ① shows a tragic scenario for crops in Parana, a drop caused mainly by the low performance of the west of the state. Soil moisture ② explains the catastrophic situation, with water stress being the worst in the last 10 years. The estimate is that yield will be around 38.9 bags (60 kg) per hectare, about 20 bags/ha less than in the previous season.
Santa Catarina – Did the drought also affect Santa Catarina?
YES
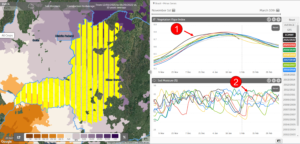
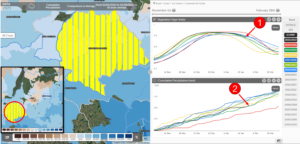
The monthly rainfall ① (from November to January) was the lowest in recent years and also below 2012, a year in which there was a crop failure. The NDVI ② is at an extremely low level during the entire cycle, which suggests a very low yield. For the state, the estimate is that yield should be 21% lower than the average of the last five years.
Rio Grande do Sul – What caused the biggest crop failure in Rio Grande do Sul?
DROUGHT AND HIGH TEMPERATURE
Vegetation indices ① showed very poor dynamics throughout the cycle. This can be explained not only by the severe drought in the state (accumulated precipitation ② was the lowest in the last 20 years), but also by the high temperature, especially in January, when maximum temperatures ③ were for several days above 32.5 °C (90,5 ° F) The estimate for the state is that productivity will be 1,710 kg/ha, around 50% lower than in the previous year.
Day 3
Western Bahia – Are there reports of the spread of diseases in the crops of Bahia?
YES
The vegetation indices ①, which was at the highest level compared to the last years until the beginning of January, showed a slight deterioration in the last few days, however, it remains above average. The heavy rains ② in December (volume was almost three times above average) resulted in high soil moisture, which facilitated the incidence of disease. However, the spread of diseases was punctual, and the production estimate is still positive for the state. For the next few days, it’s expected good rains, which should collaborate with the increase in soil moisture ③.
Tocantins – Is there cause for concern in Tocantins?
YES
The vegetation indices ① have deteriorated since the beginning of January and what is noteworthy is that from the 12th to the 23rd of January the cumulative precipitation ② was low, which reduces the possibility of reading error by the satellite due to the presence of clouds. Harvesting in the state has started, but it’s still very early on and doesn’t fully explain the drop in NDVI. However, after the low rainfall in mid-January, the rain returned, so the soil moisture ③ should return to above-average levels, which may contribute to a recovery of crops. To monitor.
Maranhão – Deterioration of the NDVI in the last few days in Maranhão is a concern?
NOT YET
The NDVI ① had great dynamics in the first third of the cycle but deteriorated in the last few days. However, the vegetation indices are in line with the year 2020 ②, a season that had a good yield. For the next few days, the forecast is for an increase in soil moisture ③, which will be favourable for the crops.
Piaui – Is there a forecast for the return of rains in the short term?
YES
Despite the drop in the vegetation indices ① in recent days, the NDVI remains above average, which lessens concerns about the yield potential. However, it will be necessary to observe the dynamics of the NDVI in the coming weeks. For the next few days, the forecast is for the return of rains, which will result in higher soil moisture ②, favourable for the crops.
MATOPIBA – Are vegetation indices still at a good level in MATOPIBA?
NO
In the first third of the cycle, the dynamics of NDVI ① was good but it has deteriorated since mid-January ②, in line with the decrease in soil moisture. However, the forecast points to the return of rains in the short term, which will collaborate with the increase in soil moisture ③. Favorable scenario for crops in MATOPIBA (Maranhão, Tocantins, Piauí e Bahia).
Day 2
Northwest of Minas Gerais – Are there clear signs of crop failure in Minas Gerais?
NO
Vegetation indices have deteriorated rapidly over the last few days ① and, with the drop in soil moisture ②, the possibility of error in reading due to the presence of clouds is small. The high volume of rainfall ③ at the end of the previous year kept the soil moisture high during much of December and early January, which could facilitate the spread of diseases, however, the drop in NDVI seems to be more associated with the harvest ④, which is accelerated compared to the previous season. Therefore, we have no major concerns about the yield potential of crops in the region.
Triângulo Mineiro – NDVI points to problems at the end of the soybean cycle?
NO
Vegetation indices ① were at the highest level compared to recent years during almost the entire cycle and, as in the northwest of the state, the drop in NDVI is associated with early harvest. The cumulative precipitation ②, considering since the beginning of November, is close to the historical average. In addition, the monthly rainfall ③ was well distributed over the last few months, which did not occur in the 2018/2019 season, which explains the poor dynamics of the vegetation indices ④ in the final third of the soybean cycle this year.
Minas Gerais – Grain production should be lower than expected in Minas Gerais?
NO
The NDVI ① was high for most of the cycle, so we don’t have major concerns about the yield potential. It is estimated that soybean production will be above 63 bags (60 kg) per hectare. After a period of drought in January, the rains returned, which will result in the recovery of soil moisture ②, favourable for the beginning of the second corn crop cycle.
São Paulo Grain Belt – Does the NDVI show an analogy with the bad 2018/19 season?
NÃO
The vegetation indices ① showed good dynamics during almost the entire cycle. The drop in the last few days could be a misreading due to the high rainfall at the end of January. The rise in soil moisture ② and the cumulative precipitation curve ③ in the last week gives support to this theory.
São Paulo – Can soybean production be a record in the state?
SIM
Despite the average to bad dynamics of the NDVI ① during the cycle, the estimated area planted with soybeans was 1.22 million hectares (the largest in the historical series), which may contribute to a record state production. However, it is still too early to make such a statement. Good volumes of rain will be needed for this scenario to be consolidated. The recent drop in the vegetation indices may be a reading error due to the presence of clouds. The high rainfall ② recorded in recent days gives support to this theory. However, heavy rains in some regions may have had negative impacts. It will be necessary to wait a few days to assess the situation of crops in these areas.
Day 1
Micro-region of Alto Teles Pires, Sinop and Paranatinga – Does the evolution of the vegetation index show problems throughout the cycle?
NO
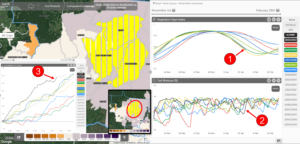
In the Alto Teles Pires, Sinop and Paranatinga micro-regions, the NDVI ① was similar to the curve of the 2018/19 and 2019/20 seasons, crops that had yielded in line with the trend or better (0% in 2019 and 7% above the trend in 2020), which indicates a yield, at least, in line with the trend in the current season. Soil moisture ② was at a good level during most of the cycle, which allowed the good development of crops. However, in some areas, there were above average rainfall, mainly in northern Sinop. The water balance (Precipitation – Evapotranspiration) ③ confirms the highest volume of rainfall in the current season. There are feedbacks from the fields of diseases spreading, which may result in lower yield, but it’s punctual and should not present significant changes for state production.
Mato Grosso – State soybean production can be a record?
YES
The NDVI ① during the current season presented very similar dynamics to the 2018/2019 season, with moments when soil moisture ② was even better than in comparison with the analogous year (2019). This indicates that the yield (in relation to the trend) should also be similar to the analogue year. The yield should reach from 57 to 60 bags (60 kg) per hectare. Some feedback from the field should be considered, which report a spread of diseases in some regions, mainly in the north of the state. However, the reports have been from specific areas and the deterioration of vegetation indices seems to be more linked to accelerated harvest ③ than to any significant problem of diseases in the crops.
Southwest of Goias – Was the volume of rains in the region sufficient to meet the requirements of soybean crops?
YES
In southwest Goias, the NDVI ① was at a good level throughout the cycle, similar to the 2019/2020 season, a year with a yield above the trend (+8%), which indicates that the current crop should also be positive. Considering since the beginning of November, the accumulated precipitation ② is a little below average (mainly due to the low precipitation in part of January), but it was enough to allow good development of the crops in December and the beginning of January.
Goias – Are soybean crops in Goias at an advanced stage compared to last season?
YES
The vegetation indices ① was high during the first two-thirds of the cycle, which indicates good crop conditions and above-trend yield. The cumulative precipitation ② (considering since the beginning of November) is in line with the 2017/18 crop (a season with good yield). In the last few days, the dynamics of the NDVI has changed and the indices have dropped. However, there is no big concern in terms of production potential, as we believe that this drop is more related to an early harvest. In fact, the early harvest will allow the planting of a second corn crop in a more favourable period compared to the previous year.
Center-North of Mato Grosso do Sul – Should low rainfall result in low yield in the region?
NO
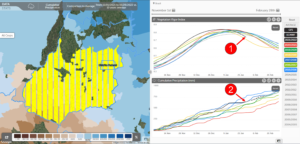
In the region, the vegetation indices ① showed good dynamics, especially in the first half of the cycle. Despite the cumulative precipitation ② (considering since 11/20) below average, the volume of rainfall was sufficient to allow better development of soybean compared to the southern region of the state.
Center-South of Mato Grosso do Sul – Is the soybean crop failure already consolidated in the region?
YES
In the entire southern region of the state, the volume of rainfall was well below what was necessary to meet the water requirements of the plants. The cumulative precipitation ① since the beginning of November was the lowest in 22 years. As a result, the soil moisture ② was well below average. Thus, the vegetation indices ③ evidence the drought, with a catastrophic dynamic, mainly from mid-December. The estimate is that the yield is 3.8% to 8.5% lower than the average of the last 5 years.

